Wiki edits per second using Apache Beam pipeline! Supporting tagline
In this blog, we will visualise the number of wiki edits per second from a live feed. Here is an architecture diagram of the various components in this example
Architecture
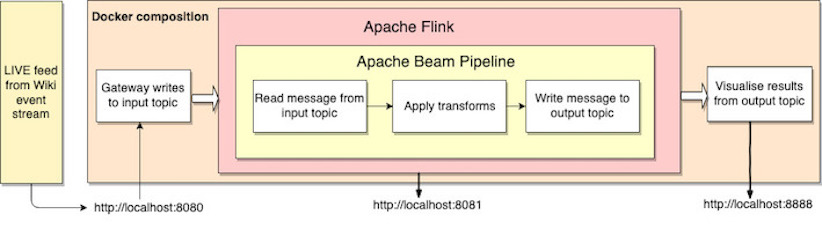
To begin, start up the containers shown in the architecture using the command.
docker-compose up `
List the names of the running containers via
docker ps --format {{.Names}} `
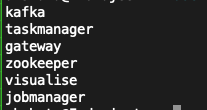
The 3 containers are which are of particular interest here are
gateway
Exposes a REST API written in go which is accessible via port 8080. Live stream from wiki is routed through the gateway to an input Kafka topic. The gateway interacts with the kafka and zookeeper containers within the docker network. The kafka topic can be accessed from within the kafka container via port 9092. Within the docker network, it is accessed via kafka:9093.
jobmanager
Runs a flink server and exposes a web dashboard accessible via port 8081. The taskmanager container is internally used by the jobmanager for job assignments.
visualise
Exposes a Jupyter lab server accessible via port 8888. The counts computed by the pipeline is read from the output topic in the notebook.
Feeding data to the gateway
A python script at the root of the repository reads data from the wiki event stream api and sends it to the gateway. Run the python script with the following command
python wiki_stream.py
Building the pipeline
The data pipeline computes the wiki edits per seconds. It is written using the Java sdk for Apache Beam and performs the following steps.
-
Reads the data from the input Kafka topic.
-
Assigns the received timestamp to the input.
-
Windows over the input at intervals of 1 second.
-
Counts the number of records in the window interval.
-
Gets the window bounds
-
Writes the window upper bound and count to the output kafka topic.
Run the pipeline using the direct-runner for testing with the following command.
make direct-run
Deploying the pipeline
The data pipeline JAR file must be created with the flink-runner so that the Flink server can run it. Build a flink compatible JAR with the following command
make flink-compile
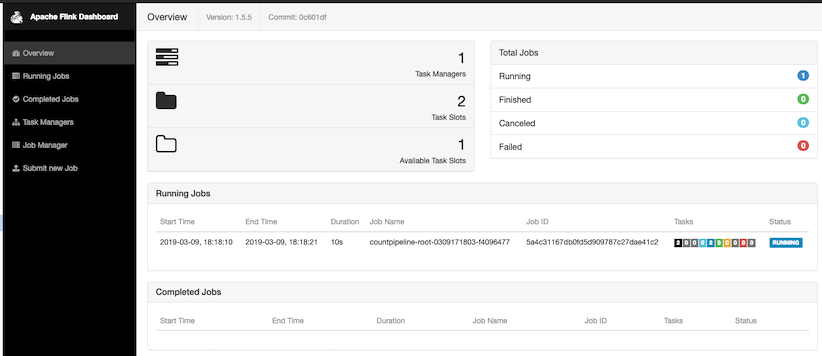
Next, we run the JAR file on the Flink server via
make flink-run
The status of the running job is accessible via the dashboard at http://localhost:8081.
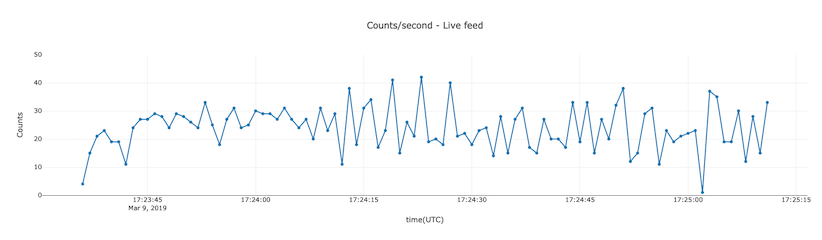
Visualizing the data
We use the python library named plotly to display a timebased graph of the computation. Run all the cells of the graph.ipynb notebook. The last cell reads data from the output kafka topic and updates the plot every second.
The code repository for the project is here